Solutions/Energy management & NILM
shippedEnergy & sustainability

Energy management & NILM

A 12% increase in energy use does not identify the load or operating condition behind it. Finance needs attribution by line and shift, while ESG reporting needs a traceable conversion from measured kWh. Full sub-metering can be too expensive for every circuit.

Field
NILM node + 3-phase meters + smart relays
Edge
CT clamps & occupancy sensing
Platform
InfiIoT disaggregation + CO₂ model
Outcome
Attributed savings the board accepts
One accountable stack

We specify the field hardware and the software around the same asset model, with one engineering team responsible for the result.
The hardware, specifiedIndia-first · certified · locally supported
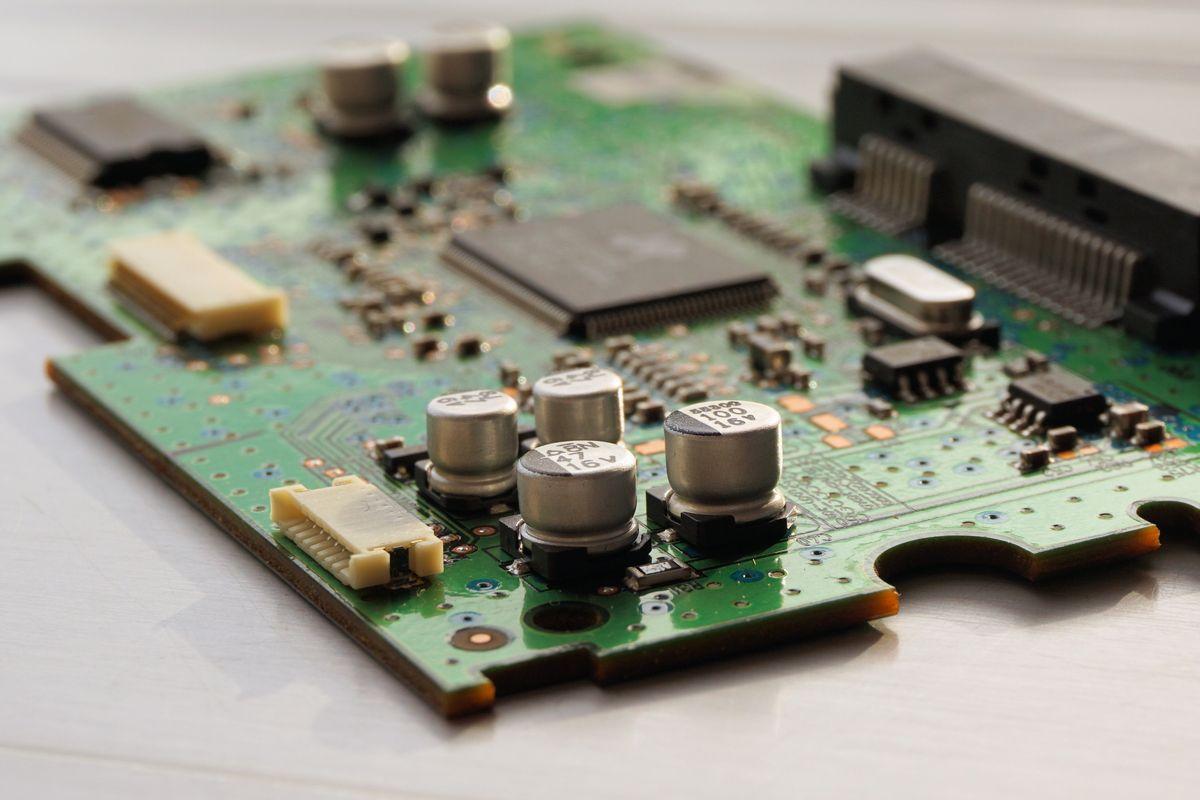
NILM load-monitoring node (SenseIoT)

NILM load-monitoring node (SenseIoT)

Disaggregates loads from one measurement point
Non-intrusive load monitoring at the panelAppliance-level signaturesMQTT to InfiIoT
Why thisSenseIoT is our India-designed node for estimating appliance-level consumption where circuit-level submetering is impractical.
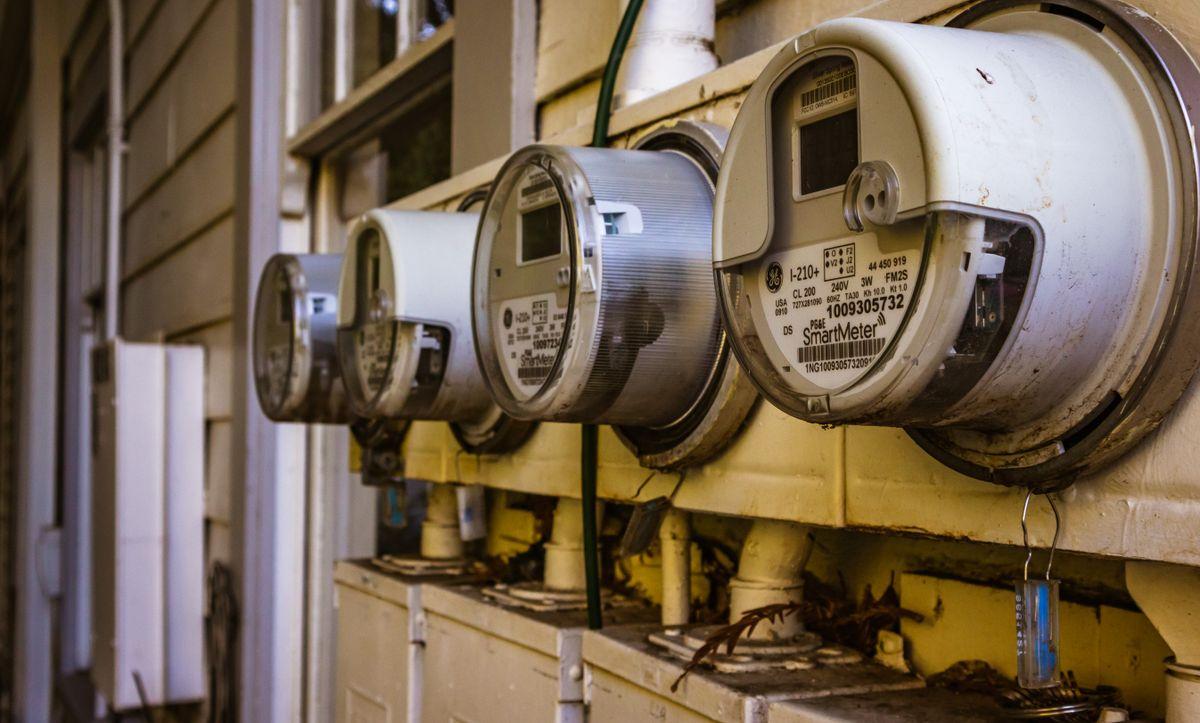
3-phase energy meter

3-phase energy meter

Provides panel- and feeder-level measurements
Class 1.0 / 0.5S, RS485 ModbusHarmonics & power factorDLMS-capable variants
Why thisThe protocol library supports common BIS-standard meters, allowing existing compatible meters to remain in service.
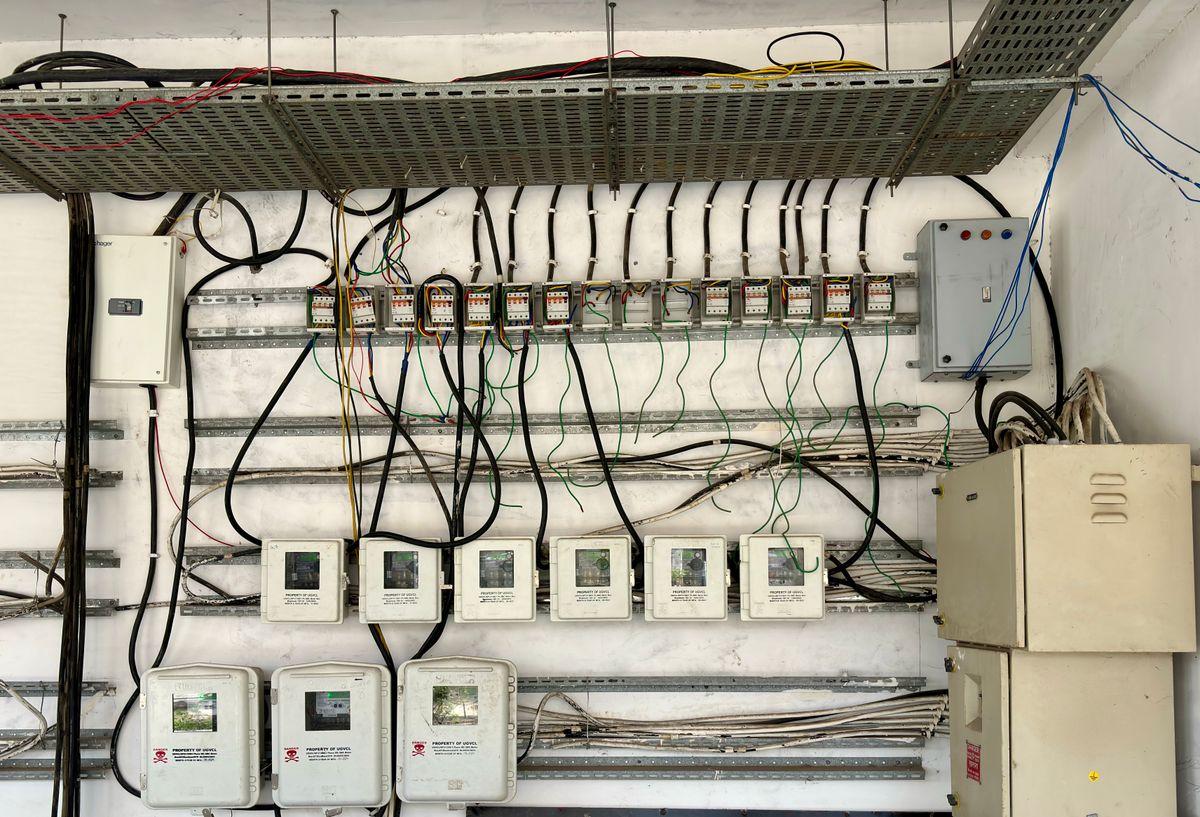
Smart relay / load controller

Smart relay / load controller

Acts on the insight automatically

Contactor control for HVAC / lightingSchedule + occupancy triggersLocal override
Why thisTurns analysis into savings that run every night without anyone remembering.
The InfiIoT software layer

What the platform does with all that hardware data.

Load disaggregation

NILM estimates consumption by appliance or line, making it possible to trace a 12% increase to a specific load and shift.

Baselines & anomaly detection

Per-feeder baselines expose drift and loads that continue outside expected operating hours.

Occupancy-driven control

HVAC and lighting schedules follow measured occupancy while preserving local override.

kWh → CO₂ reporting

Measured consumption is converted to CO₂-equivalent with the factor and reporting period kept in the audit trail.

What the decision maker gets
per-load
consumption attribution
measured
kWh basis for CO₂ reporting
nightly
automated savings

Hardware and software, one proposal.

Bring the asset, interfaces, and operating constraint. We will map the likely bill of materials and the first platform workflow.

Connected-product assessment

Bring one product. Leave with a clear next step.

Use 30 minutes to test the fit around one product and one blocked decision. If there is a fit, we will outline the two-week Product Blueprint.

30-minute fit callOne productNo prepared deck