Solutions/Smart manufacturing & OEE
deployedManufacturing

Smart manufacturing & OEE

OEE lives on a whiteboard, updated at end of shift from memory. Downtime reasons are guessed, micro-stops vanish, and the machine data that would settle it is trapped in PLCs that were never networked.

Field
PLCs, energy meters, andon & vibration
Edge
Gateway with S7/MC/Modbus drivers
Platform
InfiIoT OEE + downtime engine
Outcome
Live OEE, real downtime reasons
One accountable stack

We specify the field hardware and the software around the same asset model, with one engineering team responsible for the result.
The hardware, specifiedIndia-first · certified · locally supported
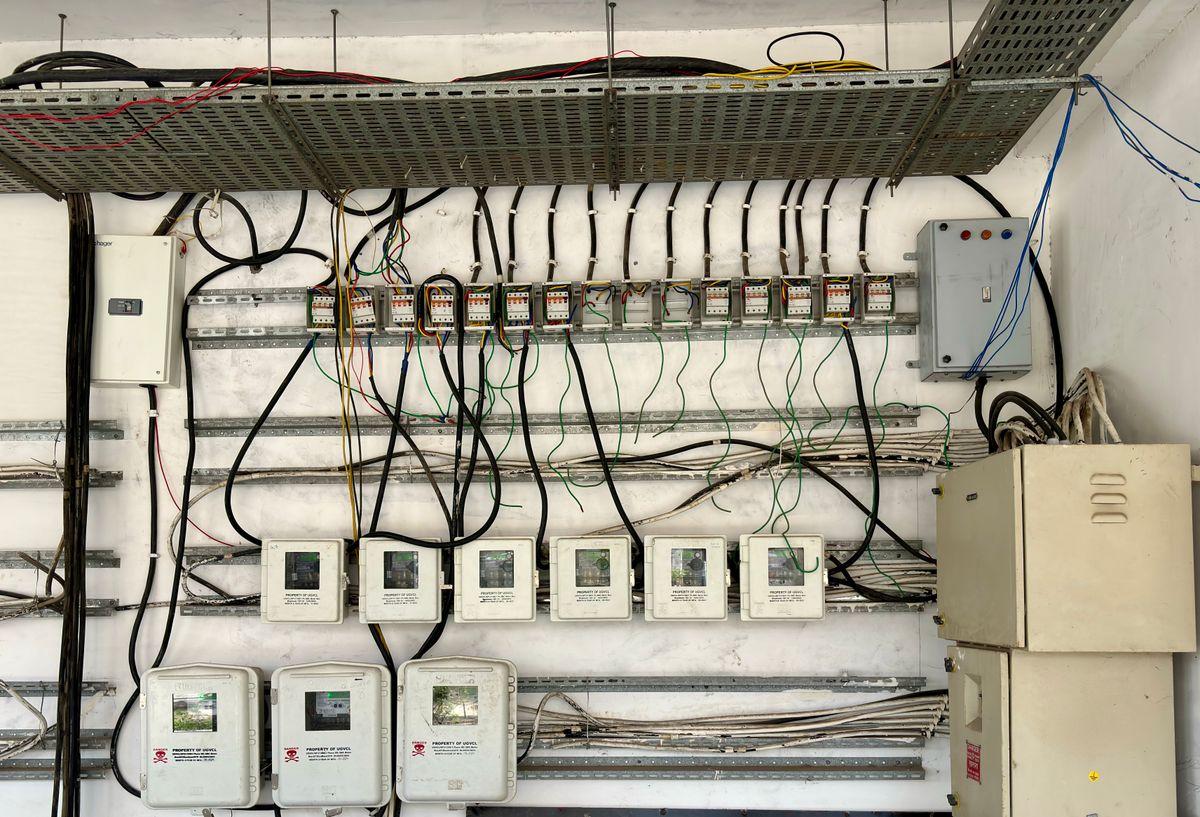
Edge gateway with PLC protocol drivers

Edge gateway with PLC protocol drivers

Reads the machines without touching their code
Siemens S7, Mitsubishi MC, Modbus, PROFINETEdge compute, MQTT(S) outGigE + Wi-Fi + optional 4G
Why thisIndia-engineered gateways make per-machine economics work across a large shop floor.
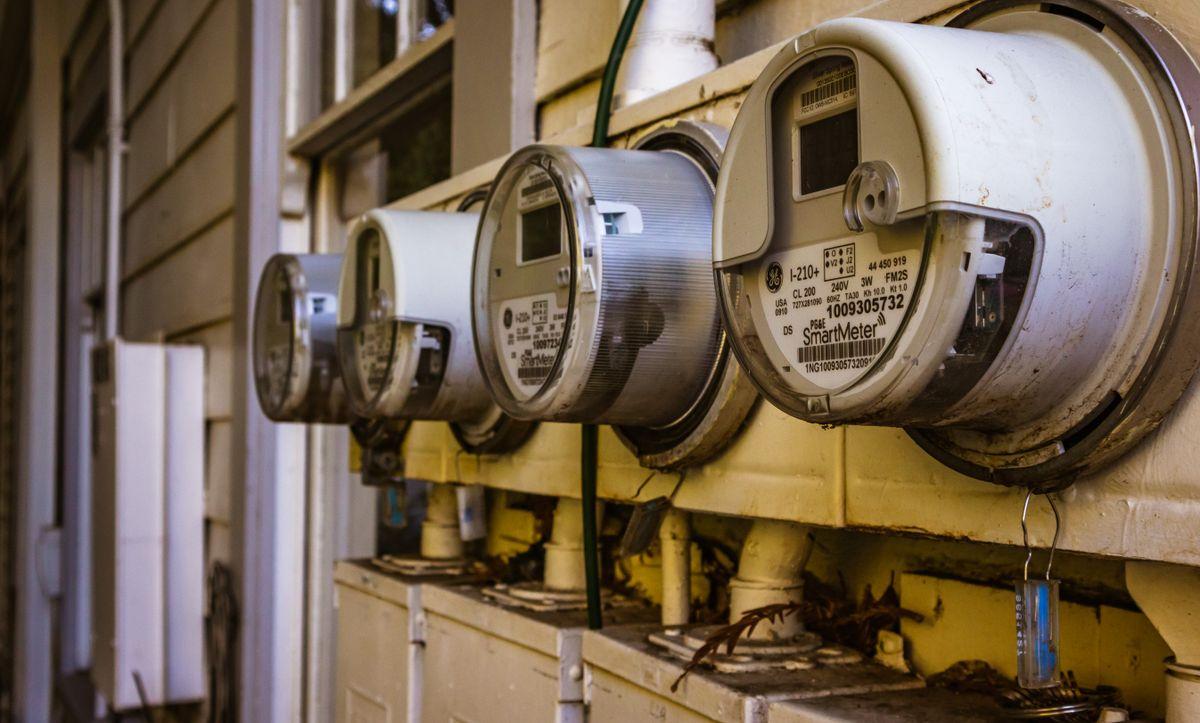
Machine energy meter

Machine energy meter

Ties output to energy per unit
3-phase, RS485 ModbusPer-machine sub-meteringPower factor & harmonics
Why thisUses measured machine energy as the basis for cost per part.
Vibration & andon inputs

Vibration & andon inputs

Condition and stoppage signals

Triaxial vibration nodeAndon / stack-light digital inputsLocal + cloud thresholds
Why thisMicro-stops and abnormal vibration surface the same second they happen.
The InfiIoT software layer

What the platform does with all that hardware data.

Live OEE

Availability, performance, and quality are computed from machine signals throughout the shift rather than reconstructed at the end.

Downtime reason capture

Each stoppage is timestamped and categorised so the downtime Pareto reflects recorded events rather than shift-end memory.

Energy-per-unit analytics

Linking consumption to production gives a measured energy cost per part for efficiency work.

Shift & production reports

Shift, line, and plant reports are generated from recorded machine events and production counts.

What the decision maker gets
live
OEE during the shift
ranked
downtime reasons
per-part
true energy cost

Hardware and software, one proposal.

Bring the asset, interfaces, and operating constraint. We will map the likely bill of materials and the first platform workflow.

Connected-product assessment

Bring one product. Leave with a clear next step.

Use 30 minutes to test the fit around one product and one blocked decision. If there is a fit, we will outline the two-week Product Blueprint.

30-minute fit callOne productNo prepared deck